Independent research reference · verified September 16, 2026
Warehouse Energy Consumption: U.S. Data by Building Type
A source-led reference to 2018 U.S. Energy Information Administration warehouse benchmarks, energy intensity, end uses, regional context and the limits of local data.
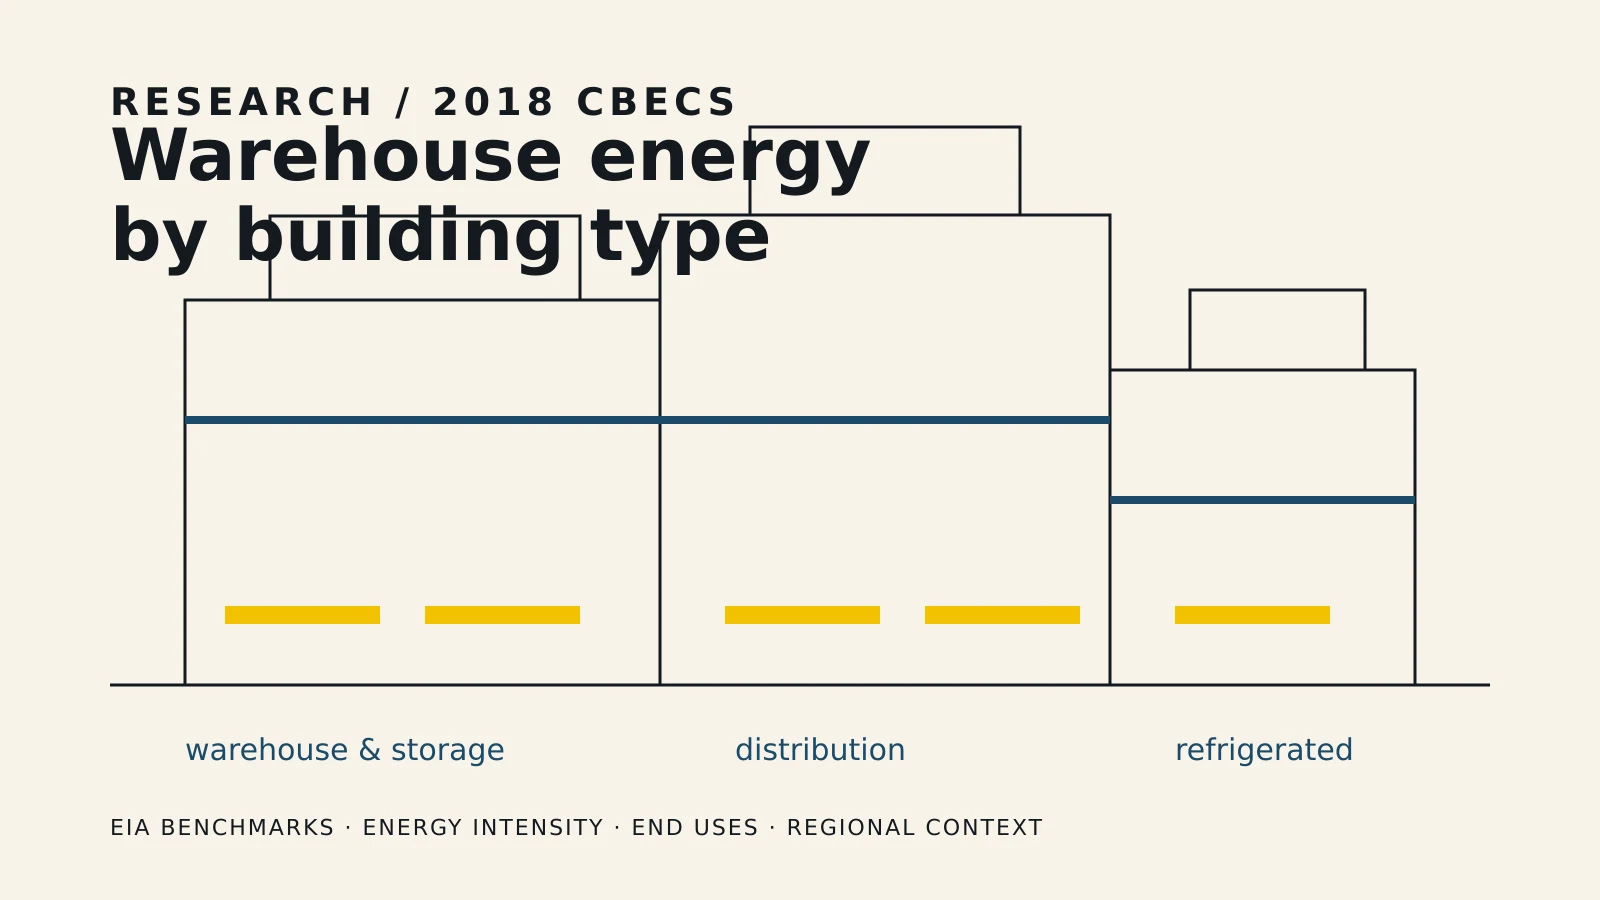
Which warehouse energy consumption statistics matter most?
Distribution and shipping centers were about 16.6% of U.S. warehouse and storage buildings in 2018 but accounted for 52.1% of the category’s major-fuel energy consumption. Our calculations divide 167,000 by 1,004,000 buildings and 275 by 528 trillion Btu; EIA’s own summary rounds the energy share to 52%. (U.S. Energy Information Administration; C12.)
U.S. warehouse and storage buildings consumed 528 trillion Btu of major-fuel energy in 2018 — electricity, natural gas, fuel oil and district heat combined. (U.S. Energy Information Administration; C12.)
U.S. warehouse and storage gross mean energy intensity was 30.2 kBtu per square foot in 2018, versus a building-level median of 14.0 kBtu per square foot. The mean is 2.16 times the median, but the statistics have different weighting: floorspace for the gross mean and buildings for the median. (U.S. Energy Information Administration; C12.)
Warehouse and storage buildings held about 18% of U.S. commercial floorspace in 2018 but accounted for about 8% of commercial-building energy use. These are EIA’s rounded category shares. (U.S. Energy Information Administration; PROFILE.)
U.S. refrigerated warehouses averaged 107.0 kBtu per square foot in 2018 — about 4.1 times the 26.1 kBtu per square foot averaged by the nonrefrigerated warehouse subgroup. The refrigerated gross mean carries an 18.5% relative standard error. (U.S. Energy Information Administration; C12.)
U.S. refrigerated warehouses using electricity averaged 29.6 kWh per square foot in 2018, compared with 5.9 kWh for distribution or shipping centers using electricity. These are whole-building electricity measures, not refrigeration-only consumption. (U.S. Energy Information Administration; C22.)
Space heating and lighting together represented approximately 54.5% of U.S. warehouse and storage major-fuel energy in 2018, calculated from EIA’s modeled end-use estimates of 208 and 80 trillion Btu, respectively, divided by the 528-trillion-Btu category total. (U.S. Energy Information Administration; E1.)
U.S. warehouse and storage buildings using electricity consumed 95 billion kWh in 2018, averaging 5.8 kWh per square foot across the floorspace of electricity-using buildings. (U.S. Energy Information Administration; C22.)
About 93.4% of U.S. warehouse and storage floorspace was in buildings using electricity in 2018, compared with 59.0% in buildings using natural gas. These are our calculations from EIA’s fuel-user and whole-category floorspace estimates. (U.S. Energy Information Administration; C22; C12; C32.)
The average U.S. distribution or shipping center was approximately 47,800 square feet in 2018 — about 3.7 times the 12,900-square-foot average nonrefrigerated warehouse. These are EIA’s published per-building averages, rather than quotients of rounded building counts. (U.S. Energy Information Administration; C12.)
Warehouse and storage buildings in the East North Central division averaged 35.6 kBtu per square foot in 2018 — about 18% above the national gross mean. This five-state regional estimate includes Wisconsin and carries an 8.6% relative standard error; it is not a Wisconsin-only measurement. (U.S. Energy Information Administration; C7; Census division definitions; C12.)
The federal warehouse benchmarks compared here span 2.1 to 235.6 kBtu per square foot per year, from EIA’s 2018 self-storage site-energy median to EPA’s refrigerated-warehouse source-energy median in its August 2024 reference. This is a comparison of different populations, statistics and energy bases, not a range of like-for-like warehouse consumption. (EPA ENERGY STAR; EPA; EIA C12.)
Published U.S. warehouse energy use increased 23.1% between the 2012 and 2018 CBECS snapshots while floorspace increased 33.7%; gross intensity decreased 7.9%. The intensity figures were 32.8 and 30.2 kBtu per square foot, respectively; the percentage differences are our calculations, not a same-building efficiency result. (U.S. Energy Information Administration; PBA3; 2018 C12.)
2018 remains the latest full CBECS reference year listed by EIA as of September 16, 2026. A 2026 source check does not make the warehouse observations 2026 measurements. (U.S. Energy Information Administration; OVERVIEW.)
CBECS publishes no state, county or city estimates, according to EIA’s geographic-availability guidance checked September 16, 2026. Wisconsin and Milwaukee County therefore have no separate warehouse-energy estimate in this survey. (U.S. Energy Information Administration; FAQ.)
By Milwaukee Dock Door Repair Research
Last verified: September 16, 2026
CBECS observation years: 2018, with a separate 2012 comparison. EPA reference-document dates and code effective dates are identified separately.
Most U.S. warehouse energy consumption comes from a minority of the buildings. Self-storage is the mirror image of distribution: 28.4% of the building count, 6.4% of the energy. Both comparisons come out of EIA’s published tables; the value of putting them together is showing exactly which kind of warehouse each number describes. Source: EIA C12.
On this page: National baseline · Who uses the energy? · Energy per square foot · Why published figures disagree · End uses · Regional differences · Wisconsin and Milwaukee County · Cargo-door energy-code references · Changes since 2012 · Data vintage · Methodology · Limitations · Excluded figures and evidence boundaries · Dataset files · Questions · Primary sources · Citation details
How much energy do U.S. warehouse buildings use?
U.S. warehouse and storage buildings consumed 528 trillion Btu of major-fuel energy in 2018, across roughly 1,004,000 buildings and 17.48 billion square feet of floorspace. That works out to a gross mean of 30.2 thousand Btu per square foot per year. Warehouses were the most common commercial building type in the country in that survey year and held about 18% of all commercial floorspace, but accounted for only about 8% of commercial-building energy use. EIA C12; EIA warehouse and storage profile.
Survey coverage. CBECS covers roofed and walled commercial buildings larger than 1,000 square feet whose principal activities are nonresidential, nonagricultural and nonindustrial. The warehouse totals here refer to that survey population, not every storage structure or logistics business in the country. Source: EIA’s table guide.
Major fuels here means electricity, natural gas, fuel oil and district heat. These figures describe the survey’s four-major-fuel building-energy boundary, not all fuels used throughout warehousing, freight transport or the supply chain. Adding a broader logistics fuel estimate would change the subject and the denominator. EIA table definitions.
Gross mean intensity divides total category energy by total category floorspace — including floorspace in buildings that use none of a given fuel. That matters more than it sounds, and the next two sections show why. kBtu means one thousand British thermal units; every intensity on this page is annual unless a different time basis is stated. EIA guide to the tables.
The comparison most readers want: all U.S. commercial buildings together used 6,787 trillion Btu across 96.423 billion square feet in 2018, with a published gross mean of 70.4 kBtu per square foot. The warehouse category’s 30.2 is about 43% of that mean. Warehouses were energy-light per square foot relative to commercial buildings overall, while their large amount of floorspace contributed to a substantial aggregate total. EIA C12; 43% comparison calculated from the published intensities.
| Measure | Warehouse and storage | All commercial buildings | Warehouse comparison |
|---|---|---|---|
| Buildings | Approximately 1,004,000 | Approximately 5,918,000 | About 17% of buildings |
| Floorspace | 17.483 billion sq ft | 96.423 billion sq ft | About 18% of floorspace |
| Major-fuel energy | 528 trillion Btu | 6,787 trillion Btu | About 8% of energy |
| Gross mean intensity | 30.2 kBtu/sq ft/year | 70.4 kBtu/sq ft/year | About 43% of the all-commercial mean |
Source: U.S. Energy Information Administration, 2018 CBECS table C12 and Warehouse and Storage profile. Building, floorspace and energy shares are EIA’s published rounded shares; the 43% intensity comparison is our calculation, 30.2 ÷ 70.4. Verified September 16, 2026.
Which warehouses actually use the energy?
Four building types share the “warehouse and storage” label, and they are not close to equivalent. Distribution and shipping centers were 16.6% of the buildings and 52.1% of the energy in 2018, while self-storage was 28.4% of the buildings and 6.4% of the energy. Refrigerated warehouses were 0.3% of the buildings and 6.6% of the energy — a category with a small estimated building count and a much larger energy share. EIA C12; shares calculated from rounded estimates.
This is an original compilation and calculation from EIA’s public estimates, not a new survey. The building-count, floorspace and consumption columns are placed on matching category definitions so the comparison can be reproduced without switching populations between sources. EIA also publishes its own rounded energy-share summary; we do not claim ownership of the underlying government data or that no other comparison exists. EIA C12; EIA warehouse profile.
| Building type | Buildings (thousands) | Share of buildings | Share of floorspace | Share of category energy |
|---|---|---|---|---|
| Nonrefrigerated warehouse | 548 | 54.6% | 40.3% | 34.8% |
| Distribution or shipping center | 167 | 16.6% | 45.7% | 52.1% |
| Self-storage units | 285 | 28.4% | 12.1% | 6.4% |
| Refrigerated warehouse | 3 | 0.3% | 1.9% | 6.6% |
Source: U.S. Energy Information Administration, 2018 CBECS table C12; building-characteristics cross-reference table B15. Shares are our calculations from EIA’s rounded published estimates: category buildings divided by 1,004 thousand, category energy divided by 528 trillion Btu, and category floorspace divided by 17,483 million square feet. Rounding means the displayed columns need not total exactly 100%. Counts are survey estimates of buildings, not of companies, leases or individual storage units. Verified September 16, 2026.
Dataset: Building-type benchmarks and derived shares, CSV · Complete structured dataset, JSON · File contents and reproduction method · Publication and citation details.
Two further ways to read the same four categories are average building size and energy per building. For these measures, the table below preserves EIA’s directly published per-building estimates, rather than dividing its rounded totals by its rounded counts. The distinction becomes particularly important when a building count is published to the nearest thousand. EIA C12.
Average building size. A distribution or shipping center averaged about 47,800 square feet in 2018, against 12,900 for a nonrefrigerated warehouse and 7,400 for a self-storage building. Distribution centers were roughly 3.7 times the size of the nonrefrigerated warehouses that outnumbered them by about three to one. Building size and energy per square foot both contribute to the difference in total energy shares; this comparison does not isolate a causal contribution from either. EIA C12; size ratio calculated from published per-building estimates.
Energy per building. EIA reports approximately 1,647 million Btu a year per distribution center, 335 million per nonrefrigerated warehouse and 120 million per self-storage building. Its published refrigerated-warehouse estimate is 10,144 million Btu per building, about 30 times the nonrefrigerated-warehouse estimate. The refrigerated count has a 44.7% relative standard error, and its published energy-per-building estimate has a 27.5% relative standard error; a ratio constructed from those small-category estimates is not a precise engineering benchmark. EIA C12 and its RSE table.
| Building type | Average size (sq ft) | Energy per building (million Btu/year) | Energy per building relative to a nonrefrigerated warehouse |
|---|---|---|---|
| Nonrefrigerated warehouse | Approximately 12,900 | 335 | 1.0× |
| Distribution or shipping center | Approximately 47,800 | 1,647 | 4.9× |
| Self-storage units | Approximately 7,400 | 120 | 0.4× |
| Refrigerated warehouse | Approximately 94,800 | 10,144 | 30.3× |
Source: U.S. Energy Information Administration, 2018 CBECS table C12. Average size and energy per building are EIA’s published estimates; the last column divides each published energy-per-building estimate by 335 million Btu. Do not recreate these averages by dividing heavily rounded totals by rounded counts: 35 trillion Btu ÷ 3,000 buildings gives 11,667 million Btu, not EIA’s published 10,144. Verified September 16, 2026.
The fuel split needs the same rounding discipline. Converting each type’s published electricity total to Btu and dividing by its total major-fuel energy gives arithmetic results of 97.5% for refrigerated warehouses, 70.2% for self-storage, 58.3% for distribution centers and 57.5% for nonrefrigerated warehouses. Those are quotients of coarse rounded inputs, not published EIA fuel-share estimates. For refrigerated warehouses, the electricity input is rounded to 10 billion kWh; reporting the resulting 97.5% as a precise fuel mix would overstate what those inputs support. EIA C12; EIA C22; EIA’s 3,412 Btu/kWh conversion.
The rounding check makes the problem visible: using the refrigerated category’s published intensities instead gives 29.6 kWh/sq ft × 3.412 ÷ 107.0 kBtu/sq ft ≈ 94.4%, on matching published floorspace totals. The two calculations establish electricity’s dominance but do not establish a precise unrounded share. Neither one means that every refrigerated warehouse is an all-electric building. EIA C12; EIA C22; both published refrigerated floorspace totals are 327 million square feet.
What does a warehouse use per square foot?
There are four different per-square-foot answers in the CBECS tables, and they are not interchangeable: the U.S. warehouse category’s gross mean was 30.2 kBtu per square foot in 2018, and its building-level median was 14.0. Electricity-using warehouse buildings averaged 5.8 kWh per square foot, while gas-using warehouse buildings averaged 18.6 cubic feet of natural gas per square foot. The population, weighting or unit changes between these measures, so each needs its own label. EIA C12; C22; C32.
Gross mean — all category energy divided by all category floorspace, including buildings that use no gas or no electricity. It is a floorspace-weighted intensity, not the arithmetic mean of individual building intensities.
Median — the midpoint of the survey-weighted distribution of building-level intensities. It describes the building distribution, not the middle square foot of the stock.
Conditional mean — consumption of a particular fuel divided by the floorspace of buildings using that fuel. For the same fuel and underlying estimates, it is at least as high as the gross intensity, and equal when the denominators are identical.
Source for these definitions: EIA’s Guide to the 2018 CBECS Tables. Verified September 16, 2026.
The gap between mean and median is itself informative, but does not prove what caused it. Across the whole category the published mean is 2.16 times the median; in self-storage it is 7.71 times, with a gross mean of 16.2 and a median of 2.1 kBtu per square foot. Those comparisons alone do not show that a small number of conditioned facilities drove the result, because the mean and median weight the population differently. EIA C12; ratios calculated from its published intensities.
Refrigerated warehouses are the only one of the four leaf categories here whose median (113.5) exceeds its gross mean (107.0). That does not establish a narrow or uniform population: EIA’s published refrigerated building-intensity quartiles are 105.8 and 147.7 kBtu per square foot. Keep the actual distribution measures rather than inferring a distribution from the ordering of the mean and median. EIA C12.
| Building type | Major-fuel energy (trillion Btu) | Floorspace (million sq ft) | Gross mean (kBtu/sq ft/year) | Median (kBtu/sq ft/year) | Electricity (billion kWh) | Conditional electricity mean (kWh/sq ft/year) | Conditional gas mean (cu ft/sq ft/year) |
|---|---|---|---|---|---|---|---|
| Warehouse and storage — total | 528 | 17,483 | 30.2 | 14.0 | 95 | 5.8 | 18.6 |
| Nonrefrigerated — subtotal | 493 | 17,155 | 28.8 | 14.0 | 85 | 5.3 | 18.8 |
| Nonrefrigerated warehouse | 184 | 7,050 | 26.1 | 18.8 | 31 | 4.7 | 20.4 |
| Distribution or shipping center | 275 | 7,998 | 34.4 | 27.6 | 47 | 5.9 | 17.7 |
| Self-storage units | 34 | 2,107 | 16.2 | 2.1 | 7 | 5.1 | Withheld |
| Refrigerated warehouse | 35 | 327 | 107.0 | 113.5 | 10 | 29.6 | Withheld |
Source: U.S. Energy Information Administration, 2018 CBECS tables C12, C22 and C32. The first two rows are overlapping rollups, not additional building types — do not add all rows together. “Withheld” represents EIA’s Q flag: the relative standard error exceeded 50% or the reporting sample contained fewer than 20 buildings. These cells are not zero. Gas is a volume in cubic feet, not Btu, and cannot be compared directly with electricity or energy intensity without an appropriate conversion. Verified September 16, 2026.
Uncertainty belongs next to these numbers rather than in a footnote. The whole-category gross mean carries a 4.9% relative standard error. The refrigerated gross mean carries 18.5%, its total-energy estimate 33.9%, and self-storage total energy 33.4%. These published RSEs describe sampling precision; we have not calculated confidence intervals or significance tests for the derived comparisons. EIA C12 RSE table.
One more denominator changes how the fuel numbers read: 93.4% of warehouse floorspace was in buildings using electricity in 2018, but 59.0% was in buildings using natural gas. For distribution centers, the corresponding shares were 99.8% and 75.1%; for self-storage, 64.6% of floorspace was in electricity-using buildings. “Not using natural gas” is not the same as “having no gas service”: these tables classify fuel use, not the availability of a connection. EIA C12; C22; C32; floorspace shares calculated from the published totals.
Why do published warehouse energy figures disagree?
Published warehouse energy intensities can differ because they describe different buildings, different statistics and different energy bases. EPA’s August 2024 reference gives a non-refrigerated warehouse/distribution-center median of 22.7 kBtu per square foot on a site basis and 52.9 on a source basis; EIA’s 2018 whole-category gross mean is 30.2, and its whole-category median 14.0. Those figures cannot be substituted for one another just because each is called a warehouse benchmark. EPA ENERGY STAR national median table; EIA C12.
Three distinctions explain why this comparison needs more than a single number.
Site energy versus source energy. Site energy describes energy used at the property; source energy also accounts for the upstream energy involved in producing and delivering it. EPA uses source energy to compare buildings across different energy supplies. The ratios of the medians in its summary table are about 2.33 for non-refrigerated warehouses/distribution centers and 2.80 for refrigerated warehouses, but those are ratios of published benchmarks, not conversion factors to apply to every individual building. EPA ENERGY STAR technical reference.
Mean versus median. EIA publishes both means and medians; the EPA reference table publishes medians. As shown above, EIA’s warehouse category gross mean is more than twice its building-level median, but the measures have different weighting. A combined median cannot be obtained by averaging the subgroup medians. EIA C12; EIA table guide; EPA reference.
Which buildings are in the category. “Warehouse” can mean any of four CBECS subcategories, or EPA’s differently drawn property types. EPA combines non-refrigerated warehouses and distribution centers for one property type; its separately displayed Self-Storage Facility row explicitly uses CBECS Non-refrigerated Warehouse as the reference peer group. The EPA self-storage row is therefore not an EIA self-storage-only estimate. EPA national median table, storage and shipping rows.
| Figure (kBtu/sq ft/year) | Energy basis | Statistic | Population or property type | Publisher and document | Observation year or document vintage |
|---|---|---|---|---|---|
| 2.1 | Site, major fuels | Median | Self-storage units | EIA C12 | 2018 observations |
| 14.0 | Site, major fuels | Median | All warehouse and storage | EIA C12 | 2018 observations |
| 18.8 | Site, major fuels | Median | Nonrefrigerated warehouse | EIA C12 | 2018 observations |
| 20.2 | Site | Median | Self-Storage Facility; CBECS non-refrigerated warehouse peer group | EPA ENERGY STAR reference | August 2024 document; row’s observation year not stated |
| 22.7 | Site | Median | Non-Refrigerated Warehouse and Distribution Center | EPA ENERGY STAR reference | August 2024 document; row’s observation year not stated |
| 26.1 | Site, major fuels | Gross mean | Nonrefrigerated warehouse | EIA C12 | 2018 observations |
| 27.6 | Site, major fuels | Median | Distribution or shipping center | EIA C12 | 2018 observations |
| 30.2 | Site, major fuels | Gross mean | All warehouse and storage | EIA C12 | 2018 observations |
| 34.4 | Site, major fuels | Gross mean | Distribution or shipping center | EIA C12 | 2018 observations |
| 47.8 | Source | Median | Self-Storage Facility; CBECS non-refrigerated warehouse peer group | EPA ENERGY STAR reference | August 2024 document; row’s observation year not stated |
| 52.9 | Source | Median | Non-Refrigerated Warehouse and Distribution Center | EPA ENERGY STAR reference | August 2024 document; row’s observation year not stated |
| 84.1 | Site | Median | Refrigerated Warehouse | EPA ENERGY STAR reference | August 2024 document; row’s observation year not stated |
| 107.0 | Site, major fuels | Gross mean | Refrigerated warehouse | EIA C12 | 2018 observations |
| 113.5 | Site, major fuels | Median | Refrigerated warehouse | EIA C12 | 2018 observations |
| 235.6 | Source | Median | Refrigerated Warehouse | EPA ENERGY STAR reference | August 2024 document; row’s observation year not stated |
Source: U.S. Energy Information Administration, 2018 CBECS table C12; U.S. Environmental Protection Agency, ENERGY STAR U.S. Energy Use Intensity by Property Type — Technical Reference, August 2024. EPA’s summary identifies CBECS reference populations but does not specify an observation year for each listed median. Its August 2024 date is a document date, not a 2024 warehouse measurement. Verified September 16, 2026.
Two things fall out of putting them in one table.
EPA’s combined warehouse median falls between the two EIA subgroup medians. EPA’s 22.7 covers non-refrigerated warehouses and distribution centers together; EIA’s 2018 medians for those two subgroups are 18.8 and 27.6. The numerical ordering is a useful category check, not proof that the agencies used identical observations, methods or survey cycles. It does not let us reconstruct the combined median from the two separate ones. EPA reference; EIA C12.
The refrigerated figures do not match, and we are not going to smooth that over. EPA publishes a site median of 84.1, while EIA’s 2018 table publishes a median of 113.5 and a gross mean of 107.0 kBtu per square foot. EPA’s median is 25.9% below EIA’s 2018 median; stated the other way, EIA’s median is 35.0% above EPA’s. Both comparisons use the 29.4-kBtu difference, but the percentage denominator changes. EPA reference; EIA C12; percentage differences calculated here.
EPA’s warehouse score-model documentation identifies 2012 CBECS as its underlying survey. That does not, by itself, assign an observation year to every median in the separate August 2024 summary table, or establish why the refrigerated medians differ. We retain each published figure with its agency, energy basis and document vintage rather than inventing an explanation. EPA warehouse score-model documentation; warehouse technical reference; national median table.
A figure we could not trace
The pair 6.1 kWh of electricity and 13,400 Btu of natural gas per square foot per year was not matched to a primary survey table in this verification pass. Those numbers are recorded here as an excluded claim, not as a measurement or a replacement benchmark. No claim is made here about how widely they circulate or which historical population they describe.
For comparison, the verified 2018 CBECS nonrefrigerated warehouse subgroup figures are 4.7 kWh per square foot among electricity-using buildings and 20.4 cubic feet of gas per square foot among gas-using buildings. These are different measures with different denominators, so this is not a demonstrated correction of that untraced pair — it is a sourced alternative with explicit scope. EIA C22; C32.
What uses the energy inside a warehouse?
Space heating was the largest end-use allocation for U.S. warehouses in 2018 at 208 trillion Btu, or 39.4% of the category total. The pooled Other category was second at 111 trillion Btu, or 21.0%, and lighting third at 80 trillion Btu, or 15.2%. EIA models these allocations rather than separately metering each end use, which needs to be clear before anyone builds on them. EIA E1; EIA end-use estimation methodology.
Refrigeration, across the whole category including buildings with no refrigeration, was 36 trillion Btu, or 6.8%. That is a different question from how much whole-building energy is consumed by the refrigerated-warehouse subcategory. The activity label and the end-use label cannot be swapped. EIA E1; EIA C12.
EIA publishes end-use consumption in one table and end-use intensities in another, on different denominators. The intensities in table E2 are conditional — energy for that end use divided by the floorspace of buildings using it. The column below labeled gross intensity is our calculation on one common denominator: all 17,483 million square feet of warehouse floorspace, whether the building uses that end use or not. Both are legitimate; neither can be substituted for the other. EIA E1; E2; C12.
| End use | EIA modeled energy (trillion Btu) | Derived share of category energy | Derived gross intensity (kBtu/sq ft/year) | EIA conditional intensity (kBtu/sq ft/year) |
|---|---|---|---|---|
| Space heating | 208 | 39.4% | 11.9 | 15.8 |
| Other | 111 | 21.0% | 6.3 | 6.8 |
| Lighting | 80 | 15.2% | 4.6 | 5.1 |
| Cooling | 52 | 9.8% | 3.0 | 3.9 |
| Refrigeration | 36 | 6.8% | 2.1 | 3.3 |
| Ventilation | 24 | 4.5% | 1.4 | 1.7 |
| Computing | 8 | 1.5% | 0.5 | 0.6 |
| Water heating | 7 | 1.3% | 0.4 | 0.5 |
| Office equipment | 2 | 0.4% | 0.1 | 0.1 |
| Cooking | 1 | 0.2% | 0.1 | 0.5 |
Source: U.S. Energy Information Administration, 2018 CBECS tables E1 and E2, with the floorspace denominator from C12. Shares and gross intensities are our calculations: end-use trillion Btu ÷ 528 × 100, and end-use trillion Btu × 1,000 ÷ 17,483 million square feet. EIA’s independently rounded components total 529 trillion Btu against its published category total of 528; we preserve both rather than forcing them to reconcile. Conditional intensities must not be added together. Verified September 16, 2026.
The arithmetic trap worth flagging. Taking EIA’s rounded 39% heating share and multiplying by the 30.2 category intensity gives 11.8, close to the gross figure of 11.9 calculated from the published energy and floorspace totals. EIA separately publishes 15.8 for heating intensity, approximately 1.33 times that derived gross figure. The 15.8 is conditional on buildings using space heating; the 11.9 spreads the modeled heating energy across the entire warehouse category, including buildings not using space heating. EIA warehouse profile; E1; E2; C12.
Space heating and lighting together were 54.5% of warehouse energy in 2018: (208 + 80) ÷ 528 × 100. That is a combined share calculated from EIA’s modeled components, not a claim that this energy was wasted or could be eliminated. The tables provide no intervention estimate for doors, weatherseals or any other building component. EIA E1; EIA methodology.
Does warehouse energy use vary by region?
It does: the published 2018 warehouse gross intensities range from 20.1 kBtu per square foot in the Pacific division to 42.3 in West North Central, against a national gross mean of 30.2. The East North Central division, which includes Wisconsin, averaged 35.6, about 18% above the national figure. These are estimates for nine census divisions with their own uncertainty, not state numbers or a weather-adjusted efficiency ranking. EIA C7; C8; C9; C12.
| Census division | Major-fuel energy (trillion Btu) | Floorspace (million sq ft) | Gross mean intensity (kBtu/sq ft/year) | Intensity RSE | Member states and DC |
|---|---|---|---|---|---|
| New England | 12 | 469 | 25.1 | 15.3% | CT, ME, MA, NH, RI, VT |
| Middle Atlantic | 72 | 1,929 | 37.5 | 6.3% | NJ, NY, PA |
| East North Central | 121 | 3,402 | 35.6 | 8.6% | IL, IN, MI, OH, WI |
| West North Central | 56 | 1,312 | 42.3 | 19.9% | IA, KS, MN, MO, NE, ND, SD |
| South Atlantic | 83 | 3,034 | 27.5 | 10.4% | DE, DC, FL, GA, MD, NC, SC, VA, WV |
| East South Central | 38 | 1,250 | 30.1 | 10.2% | AL, KY, MS, TN |
| West South Central | 56 | 2,080 | 27.1 | 17.7% | AR, LA, OK, TX |
| Mountain | 31 | 1,049 | 29.2 | 14.5% | AZ, CO, ID, MT, NV, NM, UT, WY |
| Pacific | 60 | 2,958 | 20.1 | 14.9% | AK, CA, HI, OR, WA |
Source: U.S. Energy Information Administration, 2018 CBECS tables C7, C8 and C9, including their RSE tables; division membership from the U.S. Census Bureau. RSE is the relative standard error of the intensity estimate. The rounded energy column sums to 529 trillion Btu against the published national 528; floorspace sums to 17,483 million square feet, matching the national total. Verified September 16, 2026.
Regional files: Nine-division dataset, CSV · State and District of Columbia applicability lookup, CSV. The lookup contains 51 rows and labels its numeric field regional_benchmark, not state energy consumption.
Two cautions on reading this table. First, the differences between divisions have not been significance-tested in this compilation, and several estimates carry double-digit relative standard errors — West North Central’s 42.3 comes with a 19.9% RSE. Second, these are observed-year survey estimates, not weather-normalized comparisons; the table does not separate the effects of climate, building mix, operating practices or other factors. The national 39.4% modeled heating share is not enough to calculate how much of a regional difference is attributable to climate. EIA C8; E1; table definitions.
What do Wisconsin and Milwaukee County data actually show?
CBECS publishes no separate warehouse energy estimate for Wisconsin or Milwaukee County. EIA states the geographic limit directly in its FAQ: the census division is the smallest geographic level available. The applicable regional context is 35.6 kBtu per square foot in 2018 for East North Central, which combines Illinois, Indiana, Michigan, Ohio and Wisconsin. EIA geographic-availability guidance; C7; Census division definitions.
We are publishing that survey limitation rather than filling it with a local-looking measurement. Multiplying a national or regional intensity by local warehouse floorspace would produce an estimate based on an assumed transferable benchmark, not observed local consumption. Employment and establishment counts are different denominators again; none of those operations turns CBECS into a county measurement.
| Geography | Warehouse energy estimate in CBECS | Available regional context |
|---|---|---|
| Wisconsin | Not published | East North Central, 35.6 kBtu/sq ft/year in 2018 — a five-state, floorspace-weighted benchmark |
| Milwaukee County, Wisconsin | Not published | The same East North Central benchmark; not a county measurement |
Source: U.S. Energy Information Administration, CBECS FAQ on geographic detail and 2018 table C7. This records a limitation of CBECS specifically, not the absence of every possible local dataset, utility record or building-level disclosure. Verified September 16, 2026.
A Wisconsin figure that does exist is the statewide commercial-sector electricity average. EIA’s 2024 commercial-bill table reports 12.63 cents per kWh, an average monthly bill of $663.92, and 369,433 commercial customers in Wisconsin. These figures cover the commercial customer class, not a warehouse-only sample; the average revenue per kWh is not an individual facility’s tariff. EIA Sales, Revenue and Price, table 5B, 2024. Verified September 16, 2026.
Multiplying that broad statewide price by a national warehouse intensity can illustrate assumptions, but it is not an observed Wisconsin warehouse energy cost. It would combine different populations and reference years, and would not establish the actual billing terms or consumption of a particular building. We keep the state price context separate from the warehouse consumption tables rather than presenting it as a local cost study.
What does the energy code require of warehouse envelopes?
Commercial energy-code provisions address weatherseals at cargo and loading-dock openings, but their section numbers and adopted wording depend on the edition and jurisdiction. The 2021 IECC places its loading-dock provision at C402.5.8, while Wisconsin’s transition to its 2021-code base began September 1, 2025, with the new code mandatory for plans submitted on or after November 1, 2025. Those dates do not, by themselves, establish a retrofit obligation for every existing warehouse. ICC 2021 IECC, Chapter 4; Wisconsin DSPS adoption and transition notice.
This is a building-code reference about warehouse envelopes, not a consumption statistic or a savings claim. The crosswalk separates verified requirement text, verified index locations, and edition-only coverage rather than treating an index hit or a publisher’s edition notice as proof of a legal requirement. A model-code edition year is not a jurisdiction’s effective date.
| Code or jurisdiction | Edition or cycle | Section | Verified wording or scope | Effective date or edition | Verification coverage |
|---|---|---|---|---|---|
| IECC | 2012 | C402.4.6 | Publisher index identifies loading-dock weatherseals; model provision not reproduced here | 2012 edition | Index location only; ICC index |
| IECC | 2015 | C402.5.6 | Weatherseals limit infiltration when vehicles are parked in the doorway | 2015 edition | ★ Requirement text; ICC provision |
| 2018 IECC / New Hampshire publisher index | 2018 | C402.5.6 | Index identifies the subsection; no claim about unamended model wording | 2018 edition with New Hampshire amendments | Index location only; ICC index |
| IECC | 2021 | C402.5.8 | Weatherseals limit infiltration and contact the top and sides of parked vehicles | 2021 edition | ★ Requirement text; ICC chapter |
| ANSI/ASHRAE/IES 90.1 | 2025 | Not asserted | Edition confirmed; no weatherseal section or requirement asserted from the accessible publisher material | 2025 edition | Edition only; ASHRAE publication page |
| Washington | 2013 effective cycle | C402.4.6 | Weatherseals limit infiltration when vehicles are parked in the doorway | July 1, 2013 | ★ Text and effective date; state rule |
| Washington | 2015 code cycle | C402.5.6 | Weatherseals limit infiltration when vehicles are parked in the doorway | July 1, 2016 | ★ Prior text and date; amendment; rule history |
| Washington | 2018 code cycle | C402.5.6 | Weatherseals limit infiltration and contact the top and sides of parked vehicles | February 1, 2021, after postponement of the originally stated July 1, 2020 date | ★ Text and revised effective date; rule; SBCC notice |
| Washington | 2021 code cycle | C402.5.8 | Weatherseals limit infiltration and contact the top and sides of parked vehicles | March 15, 2024 | ★ Text and effective date; current WAC |
| Wisconsin | 2015 IECC prior base | C402.5.6 | Prior IECC provision; the state transition determines which base applies to a project | Prior base; previous-code submittals allowed during transition before November 1, 2025 | ★ Prior-base transition and model provision; DSPS; ICC |
| Wisconsin | 2021 IECC base | C402.5.8 | Top-and-side contact provision; SPS 363.0402 does not delete this subsection | Adopted September 1, 2025; mandatory for plans submitted November 1, 2025 onward | ★ Adoption, amendment and provision; DSPS; SPS 363 insert; ICC |
Source: International Code Council publisher provisions and indexes; 2015 Seattle Commercial Energy Code, Chapter 4; 2016 New York City Energy Conservation Code, Chapter C4; Washington State Legislature rule text and histories; Washington State Building Code Council effective-date notice; Wisconsin Department of Safety and Professional Services adoption notice and SPS 363 insert pages; ASHRAE publisher edition information. Individual primary-source links and the verification scope appear in each row. ★ identifies a directly checked requirement or adoption record, not merely an edition listing. All rows checked September 16, 2026.
Washington’s wording and effective dates need separate checks. Its 2019 rule filing shows the earlier infiltration provision being amended to require contact at the top and sides of parked vehicles, and originally specified July 1, 2020 as the effective date. The State Building Code Council subsequently extended the 2018-code effective date to February 1, 2021. The older date remains visible in the historical filing; it must not be presented as the final statewide implementation date. Washington 2019 rule filing; SBCC postponement notice.
Wisconsin’s adoption is established by DSPS’s own documents. The SPS 363 insert pages identify the 2021 IECC and are dated September 1, 2025. The department separately identifies the transition and November 1, 2025 plan-submittal requirement. Within the insert, SPS 363.0402 excludes item 3 of IECC C402.5.1.5; that is not the loading-dock weatherseal subsection C402.5.8. The same insert identifies ANSI/ASHRAE/IES 90.1-2019 as an alternative compliance path. SPS 363 insert, including SPS 363.0401 and 363.0402; DSPS transition notice.
The index-only rows are retained to show exactly what the source establishes, not to offer unverified compliance advice. The ASHRAE 2025 row records edition coverage only; this reference does not assign it a weatherseal section number. For a specific building or project, the jurisdiction’s adopted code, amendments, project scope and applicable transition control. This crosswalk does not determine a particular building’s compliance or prescribe hazardous work.
What changed between the 2012 and 2018 surveys?
Total U.S. warehouse energy use was 23.1% higher in the 2018 CBECS snapshot than in 2012, increasing from 429 to 528 trillion Btu. Floorspace increased faster, by 33.7%, from 13,077 to 17,483 million square feet. Gross mean intensity therefore decreased 7.9%, from 32.8 to 30.2 kBtu per square foot. EIA 2012 PBA3; 2018 C12; differences calculated from the published estimates.
| Survey year | Major-fuel energy (trillion Btu) | Floorspace (million sq ft) | Gross mean intensity (kBtu/sq ft/year) |
|---|---|---|---|
| 2012 | 429 | 13,077 | 32.8 |
| 2018 | 528 | 17,483 | 30.2 |
| Calculated difference | +23.1% | +33.7% | −7.9% |
Source: U.S. Energy Information Administration, 2012 CBECS table PBA3 and 2018 CBECS table C12. Percentage differences are our calculations: (2018 value ÷ 2012 value − 1) × 100. Verified September 16, 2026.
These are two survey snapshots, not a panel following the same buildings. The building population, operating circumstances and weather are not held constant between them, and both sets of estimates carry sampling uncertainty. The intensity decline is a descriptive difference between survey estimates, not evidence by itself of an efficiency improvement in the same facilities. There is no annual interpolation or post-2018 warehouse-consumption estimate in this comparison. EIA guidance on table interpretation and comparisons; 2012 table; 2018 table.
How current is this data?
2018 is the latest full CBECS reference year listed in EIA’s public data releases as of September 16, 2026. Building interviews for that survey ran from April 2019 to January 2020, and the reference year remained 2018 despite later collection and publication. The verification date on this page records a source check, not a new measurement of warehouse consumption. EIA CBECS overview and release history; EIA 2018 building-data collection report.
The building-characteristics and energy results were released after collection, with releases and related reports spanning 2021 through 2023. The 2018 consumption tables used here identify December 2022 as their release month. The figures describe the 2018 building stock, not every warehouse operating today and not every newer private or public building dataset. EIA release history; C12 publication information.
The gaps in this series are not new. EIA states that the 2007 CBECS did not produce a representative set of full-survey results meeting its quality standards. EIA also announced that the 2011 CBECS was suspended because of funding reductions, and its subsequent full reference-year dataset is 2012. Those are documented interruptions in the survey series, not a basis for filling missing observations with estimates. EIA CBECS FAQ; EIA survey-suspension announcement; 2012 CBECS results.
The 2018 collection yielded 6,436 responding eligible buildings across all commercial building activities, not 6,436 warehouses. EIA describes the collection and response process in its methodology; the warehouse counts in this page’s tables are weighted population estimates, not the number of responding warehouses. EIA survey FAQ; 2018 data-collection report.
What that means for anyone citing warehouse energy in 2026: the observation year is eight calendar years earlier, and it is still the latest full CBECS baseline listed in the sources checked here. The honest citation carries 2018. A new survey activity, pilot or publication is not automatically a replacement nationally representative warehouse consumption table. EIA CBECS releases; EIA survey FAQ.
How was this warehouse energy dataset assembled?
This dataset joins published EIA CBECS warehouse estimates across building-type, fuel-specific, end-use, regional and historical tables. The original contribution is the compilation, denominator reconciliation and explicitly labeled arithmetic, with EPA reference medians and code-source coverage kept separate. No microdata was processed, no utility bills were collected and no buildings were metered for this page.
What was collected. The benchmark, end-use and regional inputs were transcribed from EIA’s published 2018 CBECS C12, C22, C32, E1, E2, C7, C8 and C9 tables, including available RSE tables. Building-characteristics table B15 supplies a cross-reference, and the separate historical comparison uses the published 2012 PBA3 table. Each row was matched by the named building category, reference year and geography rather than by a general “warehouse” label. C12; C22; C32; E1; E2; C7; C8; C9; B15; PBA3.
Census division membership was taken from the U.S. Census Bureau. The national medians were read from EPA’s U.S. Energy Use Intensity by Property Type technical reference dated August 2024; its document date was not substituted for an unprovided observation year. Code provisions, edition metadata and effective dates were checked against the issuing publishers and agencies identified in Table 9, with index-only and edition-only coverage labeled as such. Census geography definitions; EPA reference; code-source crosswalk.
When. Sources used in this compilation were checked on September 16, 2026. The main CBECS observation year is 2018, with 2012 used only for the separate historical comparison. Wisconsin’s commercial electricity-price context is 2024; EPA’s summary reference is dated August 2024; each code row carries its own edition or effective date.
How it was processed. Shares, comparison ratios and gross end-use intensities are arithmetic on EIA’s published rounded estimates. Average building size and energy per building are taken from EIA’s published per-building columns rather than recreated from rounded counts. No additional measured data, forecast, modeled local consumption or interpolated year was generated; where EIA itself models a value — the end-use allocations — that status is identified. EIA C12; EIA end-use methodology.
Calculation rules. Building, floorspace and energy shares divide a leaf category by its corresponding whole-category total. Fuel-user floorspace shares divide the floorspace of fuel-using buildings by total category floorspace. Gross end-use intensity divides modeled end-use energy by all 17,483 million square feet; historical changes divide the later published estimate by the earlier estimate and subtract one. Derived percentages are generally displayed to one decimal place, and extra decimals in a calculation do not create extra measurement precision.
Reconciliation checks we ran, and what they returned.
Component sums. The four leaf-category energy figures total 528 trillion Btu, matching EIA’s warehouse total. Leaf floorspace totals 17,482 million square feet against a published 17,483, and building counts total 1,003 thousand against 1,004 thousand. The displayed estimates are independently rounded; no balancing adjustment was made. EIA C12.
Cross-table fuel check. EIA C22 reports 95 billion kWh for the category. Converting at 3,412 Btu/kWh gives 324.14 trillion Btu, compared with the 325 trillion Btu of electricity in EIA’s warehouse summary — a difference of approximately 0.3% using 325 as the denominator. This checks rounded-source consistency; it does not replace either published value. EIA C22; warehouse profile; conversion factor.
Intensity and per-building checks. Dividing 528 trillion Btu by 30.2 kBtu per square foot implies approximately 17.48 billion square feet, consistent with the published 17.483 billion after rounding. By contrast, dividing the refrigerated rounded totals by the rounded 3,000-building estimate does not reproduce EIA’s published per-building averages; the published 94,800-square-foot and 10,144-million-Btu figures are retained. EIA C12.
Regional and end-use checks. The nine division floorspace estimates total 17,483 million square feet; regional energy totals 529 trillion Btu. The ten modeled end-use components also total 529 trillion Btu, against the published national category total of 528. Both rounding differences are retained and disclosed. C7; C8; C9; E1.
Cross-agency category check. EPA’s combined warehouse/distribution median of 22.7 falls between EIA’s separate 2018 medians of 18.8 and 27.6. The check records numerical ordering only; it does not establish a common vintage or validate one estimate against the other. EPA’s refrigerated and self-storage reference differences remain visible in Table 5. EPA reference; EIA C12.
Where recomputation and publication differ. Recomputing regional intensity from the rounded energy and floorspace columns produces small differences from EIA’s published intensity column, up to about 0.5 kBtu per square foot in this table. We publish EIA’s intensity rather than replacing it with the ratio of rounded totals. The same principle applies to per-building averages and to fuel shares; the refrigerated 97.5%-versus-94.4% arithmetic comparison above is a demonstration of rounding sensitivity, not two measured fuel mixes. C7; C8; C9; C12; C22.
Verification coverage. ★ marks a directly checked requirement or adoption record in Table 9. Index-only and edition-only rows state precisely what was verified, with no unverified requirement substituted into their cells. Every numeric energy input was checked against the primary table; publisher-derived calculations are separately labeled and do not inherit an RSE that has not been calculated.
Reproducibility. The input file records the published inputs, source URLs and reference years. The Python script recalculates the displayed arithmetic and five reconciliation checks locally, without network access. The data dictionary identifies units, denominators, suppression flags and which fields are published estimates versus calculations.
Where do these warehouse benchmarks stop being comparable?
These tables are survey estimates and published reference values, not a specification for an individual warehouse. Sampling uncertainty, fuel boundaries, statistical weighting, geography and data vintage can all change the comparison. The limitations below travel with the numbers; they are not an invitation to replace a missing measurement with a more convenient estimate.
Sampling uncertainty varies by row. The national gross mean carries a 4.9% RSE; the refrigerated total-energy estimate carries 33.9%, and its building count 44.7%. Self-storage total energy carries 33.4%. Those are uncertainties of published components, not calculated uncertainties for our ratios; no statistical-significance claim is made for a derived ranking or comparison. EIA C12 RSE table.
End uses are modeled, not metered. EIA estimates the end-use allocation. The 39.4% heating share is calculated from those modeled estimates and describes energy consumed, not energy wasted or avoidable. Neither it nor the combined heating-and-lighting share provides a savings estimate for a door, weatherseal or other component. EIA E1; EIA methodology.
Rollup rows overlap. “Warehouse and storage — total” and “Nonrefrigerated — subtotal” contain the leaf categories beneath them. Adding all rows double-counts. The four leaf rows form the intended building-type comparison, with small displayed discrepancies from independent rounding. EIA C12.
Denominators and weights differ. Gross intensity is a floorspace-weighted category measure; the median is based on the building-intensity distribution; conditional fuel intensities cover fuel-using floorspace. Conditional intensities cannot simply be summed, and cubic feet of gas is a volume, not an energy unit. Ratios of medians and ratios of coarse rounded totals are not automatically physical conversion factors or precisely measured shares. EIA table guide.
Suppressed values are not zeros. EIA’s Q flag indicates that the relative standard error exceeded 50% or the reporting sample had fewer than 20 buildings. It does not mean self-storage or refrigerated warehouses use no natural gas. We do not reconstruct suppressed quantities by subtracting published rows. EIA C32 notes.
Building counts are counts of buildings. They are not counts of companies, logistics establishments, leases or individual rentable storage units. Published per-building estimates also should not be reconstructed by dividing heavily rounded counts into rounded consumption or floorspace totals. EIA C12; warehouse category definitions.
Local geography is unavailable from this survey. The smallest CBECS geographic level is the census division; there is no CBECS state, county or city estimate. These regional intensities are not weather-normalized, and the differences have not been significance-tested here. This is not a claim that no other source could hold local or building-level information. EIA geographic availability.
The core observations are historical. The main energy tables describe 2018, and the historical comparison adds a separate 2012 snapshot. EPA’s summary has an August 2024 document date, not a verified 2024 observation year for each median; the Wisconsin commercial-price paragraph uses 2024 data; code rows have their own dates. Nothing on this page measures 2026 warehouse consumption. EIA C12; PBA3; EPA reference; EIA price table.
Code references have a different purpose. A code requirement is not a measured energy result, a prediction of savings or a determination of an existing building’s compliance. Index-only and edition-only records cannot establish wording, exceptions or project applicability that was not actually verified. The jurisdiction’s adopted provisions and scope govern, not a model-code publication date on its own.
What we deliberately excluded. No invented Wisconsin or Milwaukee County warehouse-consumption total, no component savings claim without intervention evidence, no forecast, and no interpolation between survey years. The untraced 6.1 kWh and 13,400 Btu per square foot pair is not part of the verified benchmark dataset. Missing row-level EPA vintages and unavailable code text are disclosed rather than supplied from inference.
Which figures are excluded from this verified reference?
A missing source is not permission to complete a number from memory. This section records excluded assertions and the boundaries that the reviewed primary documents actually support. None of the excluded figures or unconfirmed code requirements is used as a measurement or a compliance conclusion elsewhere on the page.
EPA’s row-by-row observation years. The August 2024 summary identifies CBECS peer groups but does not state a survey year for each median. EPA’s warehouse score-model documentation identifies 2012, but we do not transfer that model vintage to every summary-table value. The apparent refrigerated-median disagreement remains labeled by agency and publication rather than assigned a speculative cause. EPA median table; warehouse score documentation.
Uninspected IECC edition text. No weatherseal section number or wording is supplied here for the 2009 or 2024 IECC. The 2012 and 2018/New Hampshire index rows in Table 9 establish locations only, not the complete requirements of an unamended model edition. These are deliberately limited records, not provisions awaiting silent publication. ICC 2012 index; ICC 2018/New Hampshire index.
ASHRAE weatherseal section numbers. The ASHRAE publisher confirms the 2025 edition, but the accessible material reviewed did not establish its weatherseal section text. This page assigns no weatherseal section number to either the 2013 or 2025 edition. Wisconsin’s separately verified reference to 90.1-2019 as an alternative compliance path does not resolve a section number in another edition. ASHRAE publication information; publisher read-only standards portal; Wisconsin SPS 363 insert.
Wisconsin’s amendment boundary. This item was resolved by reading the state insert: SPS 363.0402 excludes item 3 of IECC C402.5.1.5, not the loading-dock subsection C402.5.8. That confirms the specific amendment distinction recorded here; it does not waive the need to determine the applicable code scope or compliance path for an individual project. DSPS SPS 363 insert; 2021 IECC.
Milwaukee County’s code climate zone. No county climate-zone designation is assigned in this reference, and none is used in a consumption calculation or compliance conclusion. The census-division benchmark is not a substitute for the county climate-zone table in an adopted code. This page therefore makes no zone-number assertion from conflicting secondary descriptions.
The untraced electricity-and-gas pair. The 6.1 kWh and 13,400 Btu per square foot per year pair was not traced to a primary survey table in this pass. It is excluded from the verified numerical dataset. The alternative figures above retain their verified CBECS year, building subgroup, units and fuel-user denominators rather than claiming to resolve an unidentified historical source.
What is included in the warehouse energy dataset download?
The dataset files contain the published inputs, original calculations, denominator notes and primary-source URLs used on this page. Version 1.0.0 was checked on September 16, 2026; its main warehouse observations are from 2018, not from the verification year. The files distinguish published estimates, modeled end-use allocations, derived arithmetic, suppressed values and source-coverage limits.
Building-type benchmarks, CSV. Six rows: four building types plus the two overlapping rollups. Columns include buildings, floorspace, major-fuel energy, EIA’s published average building size and energy per building, gross mean intensity, the 25th percentile, median and 75th percentile, electricity-using buildings and floorspace, electricity totals and conditional means, gas-using buildings and floorspace, gas totals and conditional means, available RSEs, derived building/energy/area shares and explicit denominator descriptions. RSEs unavailable for quartiles are labeled as unavailable, and Q flags remain suppressed rather than zero.
End uses, CSV. Ten rows, one per end use, with EIA’s modeled consumption, the derived category share, gross intensity on the common 17,483-million-square-foot denominator and EIA’s conditional intensity. The file also records the denominator distinction and the independently rounded component-total discrepancy.
Census divisions, CSV. Nine rows with energy, floorspace, published gross intensity, RSEs for all three estimates, member states, source table and verification date. The companion state and District of Columbia lookup, CSV contains 51 rows mapping each state or DC to its division; its numeric field is explicitly a regional_benchmark, not state consumption.
Published intensity ledger, CSV. Fifteen rows covering the EIA and EPA figures in Table 5, with energy basis, statistic, population or reference peer group, publisher, document date, observation-year availability, source URL and verification date. The file does not relabel EPA’s document date as a measurement year.
Cargo-door weatherseal code crosswalk, CSV. Eleven records corresponding to Table 9, with edition or jurisdiction, verified section location where established, paraphrased scope, effective date or edition year, source URLs and verification coverage. Index-only and edition-only records do not contain an asserted unverified requirement.
Historical snapshots, CSV. Separate 2012 and 2018 records for energy, floorspace and gross mean intensity. Wisconsin and Milwaukee County availability, CSV records the local CBECS data boundary alongside regional context, not modeled local consumption.
Reproduction script, Python and published input file, JSON. Save both in the same folder and run python compute-warehouse-energy-derived.py. The script calculates the publisher-derived percentages, ratios, gross end-use intensities and historical differences, then runs the five reconciliation checks described in the methodology. It uses the saved inputs and Python’s standard library; it does not scrape sources, invent missing data or require an account.
Complete structured dataset, JSON. The benchmark tables and dated appendices in one file, with definitions and source mappings. Data dictionary, CSV identifies column meanings, units, statistical bases and missing-value treatment. Source manifest, CSV records the primary URLs and the scope of each verification.
These files are copies of this dated compilation. The issuer’s linked tables remain the authority for the underlying survey estimates and code text; a later source correction may require a new version rather than an undisclosed replacement of an old number.
What questions come up when using warehouse energy benchmarks?
The appropriate warehouse benchmark depends on the building type, energy basis, statistic and year. These answers keep those labels attached so a figure can be understood without the rest of the page.
What is the average warehouse energy consumption per square foot?
The gross mean for all U.S. warehouse and storage buildings was 30.2 kBtu per square foot in 2018, and the building-level median was 14.0. The gross mean describes energy per square foot of the stock in aggregate; the median describes the survey-weighted midpoint of building intensities. For distribution or shipping centers specifically, the gross mean was 34.4 and the median 27.6. EIA C12; EIA definitions.
How many kilowatt-hours does a warehouse use per year?
U.S. warehouse and storage buildings using electricity consumed 95 billion kWh in 2018, averaging 5.8 kWh per square foot across their floorspace. The denominator excludes buildings not using electricity, which accounted for approximately 6.6% of whole-category floorspace, calculated from EIA’s tables. A 50,000-square-foot building at that category average would work out arithmetically to 290,000 kWh a year; this is an illustration of multiplication, not a measured building or a prediction for a particular warehouse. EIA C22; C12.
Why is electricity use reported differently from total warehouse energy?
The gross total-energy intensity here covers all category floorspace, including buildings that use none of a particular fuel. The electricity and gas conditional intensities cover only floorspace in buildings using that fuel. The units also differ — kWh, kBtu and cubic feet cannot be added or compared as though they were the same quantity; a fuel conversion alone does not fix a mismatched denominator. EIA table definitions; C22; C32.
Do refrigerated warehouse figures measure refrigeration alone?
No. The 107.0 kBtu per square foot gross mean and 29.6 kWh per square foot conditional electricity figure are 2018 whole-building measures for refrigerated warehouses. Refrigeration as a modeled end use across the entire warehouse and storage category was 36 trillion Btu, or approximately 6.8% of that category total; that is a different population-and-end-use question. EIA C12; C22; E1.
Are warehouse energy statistics available by state or county?
Not from CBECS at those geographic levels. EIA identifies the census division as its smallest available geographic level; Wisconsin’s regional context is the East North Central 2018 benchmark of 35.6 kBtu per square foot, combining Illinois, Indiana, Michigan, Ohio and Wisconsin. There is no separate Milwaukee County warehouse estimate in CBECS; that does not establish the absence of all other local sources. EIA FAQ; C7; Census definitions.
Why does a page verified in 2026 use 2018 data?
Because 2018 is the latest full CBECS reference year listed by EIA as of September 16, 2026. The verification date records when the cited sources were checked; it does not convert historical observations into current measurements. The separate EPA document dates, historical survey year, code dates and Wisconsin price year are labeled individually. EIA CBECS release history.
Do warehouses use more energy than office buildings?
Not in the 2018 CBECS aggregate: warehouses and storage used 528 trillion Btu, compared with 1,093 trillion Btu for offices. Warehouses also had a lower published gross intensity — 30.2 versus 65.6 kBtu per square foot. These are category comparisons, not a claim that every warehouse uses less energy than every office. EIA C12, office and warehouse rows.
What is a good energy use intensity for a warehouse?
A benchmark is not a universal pass/fail threshold. EPA’s August 2024 reference lists a non-refrigerated warehouse/distribution-center median of 22.7 kBtu per square foot on a site basis and 52.9 on a source basis; EIA’s 2018 whole-category median is 14.0, and its gross mean 30.2. A building evaluated in a formal program should use that program’s population, energy basis and stated method, rather than substituting a differently defined survey average. EPA reference; EIA C12.
Which primary sources support this reference?
The source list separates survey observations, modeled allocations, benchmark documents and code records. All sources below were checked on September 16, 2026; the stated scope identifies what each source supports, and an edition listing or index is not treated as full requirement text.
U.S. Energy Information Administration. 2018 CBECS: Principal Building Activities — Warehouse and Storage. 2018 observations. https://www.eia.gov/consumption/commercial/pba/warehouse-and-storage.php.
U.S. Energy Information Administration. 2018 CBECS table C12: Sum of major fuel consumption totals and gross energy intensities by building activity subcategories. December 2022 release; 2018 observations. https://www.eia.gov/consumption/commercial/data/2018/ce/pdf/c12.pdf.
U.S. Energy Information Administration. 2018 CBECS table C22: Electricity consumption totals and conditional intensities by building activity subcategories. December 2022 release; 2018 observations. https://www.eia.gov/consumption/commercial/data/2018/ce/pdf/c22.pdf.
U.S. Energy Information Administration. 2018 CBECS table C32: Natural gas consumption totals and conditional intensities by building activity subcategories. December 2022 release; 2018 observations. https://www.eia.gov/consumption/commercial/data/2018/ce/pdf/c32.pdf.
U.S. Energy Information Administration. 2018 CBECS table E1: Major-fuel consumption by end use. 2018 modeled end-use estimates. https://www.eia.gov/consumption/commercial/data/2018/ce/pdf/e1.pdf.
U.S. Energy Information Administration. 2018 CBECS table E2: Major-fuel energy intensities by end use. 2018 conditional end-use estimates. https://www.eia.gov/consumption/commercial/data/2018/ce/pdf/e2.pdf.
U.S. Energy Information Administration. 2018 CBECS table C7: New England, Middle Atlantic and East North Central divisions. 2018 observations; estimate and RSE tables. https://www.eia.gov/consumption/commercial/data/2018/ce/pdf/c7.pdf.
U.S. Energy Information Administration. 2018 CBECS table C8: West North Central, South Atlantic and East South Central divisions. 2018 observations; estimate and RSE tables. https://www.eia.gov/consumption/commercial/data/2018/ce/pdf/c8.pdf.
U.S. Energy Information Administration. 2018 CBECS table C9: West South Central, Mountain and Pacific divisions. 2018 observations; estimate and RSE tables. https://www.eia.gov/consumption/commercial/data/2018/ce/pdf/c9.pdf.
U.S. Energy Information Administration. 2018 CBECS building-characteristics table B15. 2018 building activity subcategories; HTML table. https://www.eia.gov/consumption/commercial/data/2018/bc/html/b15.php.
U.S. Energy Information Administration. 2012 CBECS table PBA3: Major fuel consumption and intensities by building activity subcategory. 2012 observations; separate historical snapshot. https://www.eia.gov/consumption/commercial/data/2012/c%26e/cfm/pba3.php.
U.S. Energy Information Administration. Commercial Buildings Energy Consumption Survey overview and release history. Current release listing checked September 16, 2026. https://www.eia.gov/consumption/commercial/.
U.S. Energy Information Administration. CBECS frequently asked questions. Geographic availability, survey history and sample context. https://www.eia.gov/consumption/commercial/faq.php.
U.S. Energy Information Administration. Guide to the 2018 CBECS Tables. Statistical definitions, denominators and comparisons. https://www.eia.gov/consumption/commercial/data/2018/guide.php.
U.S. Energy Information Administration. How were end-use estimates produced for the 2018 CBECS?. Modeled end-use methodology. https://www.eia.gov/consumption/commercial/reports/2018/estimated-end-use.php.
U.S. Energy Information Administration. 2018 CBECS data collection: Building survey. Collection timing and response methodology. https://www.eia.gov/consumption/commercial/reports/2018/data-collection-buildings.php.
U.S. Energy Information Administration. EIA announcement of survey and data-program reductions. Primary announcement documenting suspension of the 2011 CBECS. https://www.eia.gov/pressroom/releases/press362.php.
U.S. Environmental Protection Agency, ENERGY STAR. U.S. Energy Use Intensity by Property Type — Technical Reference. August 2024 document; row-level observation years not specified. https://portfoliomanager.energystar.gov/pdf/reference/US%20National%20Median%20Table.pdf.
U.S. Environmental Protection Agency, ENERGY STAR. ENERGY STAR Score for Warehouses. Warehouse score-model survey reference; not an assignment of vintage to every national median. https://www.energystar.gov/buildings/tools-and-resources/energy-star-score-warehouses.
U.S. Environmental Protection Agency, ENERGY STAR. ENERGY STAR Score for Warehouses — Technical Reference. August 2018 score-model document. https://www.energystar.gov/sites/default/files/tools/Warehouse_August_2018_EN_508.pdf.
U.S. Census Bureau. Geographic levels: census regions and divisions. State/DC division membership. https://www.census.gov/programs-surveys/economic-census/geographies/levels/2022-levels.html.
U.S. Energy Information Administration. Sales, Revenue and Price, table 5B: Average monthly commercial bill by state. 2024 Wisconsin commercial customer-class context. https://www.eia.gov/electricity/sales_revenue_price/pdf/table_5B.pdf.
U.S. Energy Information Administration. Energy conversion calculators. Standard electricity conversion: 1 kWh = 3,412 Btu. https://www.eia.gov/energyexplained/units-and-calculators/energy-conversion-calculators.php.
City of Seattle. 2015 Seattle Commercial Energy Code, Chapter 4. Section C402.5.6 corroboration. https://www.seattle.gov/documents/Departments/SDCI/Codes/SeattleEnergyCode/2015SECCommercialChapter4.pdf.
City of New York. 2016 Energy Conservation Code, Chapter C4. Section C402.5.6 corroboration. https://www.nyc.gov/assets/buildings/codes-pdf/energy_code_2016/2016ECC_CHC4.pdf.
International Code Council. 2012 International Energy Conservation Code, commercial index. Index location only for C402.4.6. https://codes.iccsafe.org/content/IECC2012P5/index-ce-.
International Code Council. 2015 IECC, section C402.5.6, publisher provision. Loading-dock weatherseal wording. https://codes.iccsafe.org/s/IECC2015NY/chapter-4-ce-commercial-energy-efficiency/IECC2015-Pt01-Ch04-SecC402.5.6.
International Code Council. 2018 IECC with New Hampshire amendments, index. Index location only for C402.5.6; not verification of unamended model text. https://codes.iccsafe.org/content/NHECC2018P1/index.
International Code Council. 2021 IECC, Chapter 4 — Commercial Energy Efficiency. Section C402.5.8. https://codes.iccsafe.org/content/IECC2021V3.0/chapter-4-ce-commercial-energy-efficiency.
ASHRAE. Standard 90.1 publication page. 2025 edition existence; no weatherseal section assertion. https://www.ashrae.org/technical-resources/bookstore/standard-90-1.
ASHRAE. Read-only versions of ASHRAE standards. Publisher access route; no inaccessible provision reproduced. https://www.ashrae.org/technical-resources/standards-and-guidelines/read-only-versions-of-ashrae-standards.
Washington State Legislature. WSR 13-04-056, 2013 commercial energy rule. C402.4.6 and July 1, 2013 effective date. https://lawfilesext.leg.wa.gov/law/wsr/2013/04/13-04-056.htm.
Washington State Legislature. WSR 19-24-040, 2019 commercial energy amendments. Prior and amended C402.5.6 text; originally scheduled July 1, 2020 date. https://lawfilesext.leg.wa.gov/law/wsr/2019/24/19-24-040.htm.
Washington State Legislature. WAC 51-11C-40246: Loading dock weatherseals. C402.5.8 and statutory effective-date history. https://app.leg.wa.gov/wac/default.aspx?cite=51-11C-40246.
Washington State Building Code Council. 2018 Code Effective Date extended to February 1, 2021. Superseding implementation-date notice. https://sbcc.wa.gov/news/2018-code-effective-date-extended-february-1-2021.
Wisconsin Department of Safety and Professional Services. Commercial Buildings: code adoption and transition information. September 1, 2025 adoption and November 1, 2025 plan-submittal requirement. https://dsps.wi.gov/Pages/Programs/CommercialBuildings/Default.aspx.
Wisconsin Department of Safety and Professional Services. SPS 363 insert pages for the 2021 IECC. Dated September 1, 2025; state amendments and alternative compliance path. https://dsps.wi.gov/Documents/Programs/CommercialBuildings/SPS363Insert.pdf.
Verification history
September 16, 2026 — version 1.0.0. Source tables, calculations, denominators, available uncertainty measures, geographic scope, EPA document vintages, code references and the accompanying files checked for this compilation. No new warehouse-consumption observation year was added.
The release listing will be rechecked when preparing a revised edition. A later source verification may change the visible verification date; a substantive data revision requires an updated version and an explanation of the changed inputs. A recheck alone does not change the observation year or make an older estimate a new measurement.
What are this page’s citation details?
The publication record below identifies this compilation separately from its underlying sources. Its verification date records the source review, not a new year of warehouse measurements.
Publication: Milwaukee Dock Door Repair Research
Page title: Warehouse Energy Consumption: U.S. Data by Building Type
URL: https://milwaukeedockdoorrepair.com/research/warehouse-energy-consumption/
Underlying energy and geography sources: U.S. Energy Information Administration; U.S. Environmental Protection Agency; U.S. Census Bureau
Code sources: International Code Council; ASHRAE publisher information; Washington State Legislature and State Building Code Council; Wisconsin Department of Safety and Professional Services; the municipal code documents listed above
CBECS observation years: 2018, with a separate 2012 historical comparison
EPA benchmark document: August 2024; row-level observation years not assigned
Compilation version: 1.0.0
Last updated and verified: September 16, 2026
Milwaukee Dock Door Repair Research is the independent research and reference section of milwaukeedockdoorrepair.com.
By Milwaukee Dock Door Repair Research
Last verified: September 16, 2026